My home internet is an o2 5G “Homespot”: a GL.iNet GL-X3000 router with a Quectel RM520N-GL modem, 5G SA on band n78, and radio numbers that any support script would wave through (RSRP around -93 to -98 dBm, SINR 20 dB). For months it has been intermittently unusable, and every obvious explanation turned out to be wrong.
This post is the measurement writeup. I’m not the only one affected: a thread in the official o2 community forum1 has been documenting the same symptoms since November 2025, across at least three completely different hardware setups (a Zyxel FWA510, a ZTE MU5001, and my GL-X3000). I’m “Walfischdreck” in that thread. What I can add to the thread’s history is a day of systematic measurements with a control group, and an intervention experiment at the end that settles where the fault lives.
The one-paragraph summary: during a bad phase, IPv4 loses 80 to 97 % of packets. IPv6, over the same radio, the same cell, and the same dual-stack session, loses none. The loss is not per-packet but per-flow: each new connection draws a fate at connect time and keeps it. Some flows are dead, some limp, and some run at full speed through the very same “outage”. That pattern excludes radio problems, device problems, and congestion, and points at a load-distribution element in o2’s IPv4 core path that is partially broken. I can’t see inside o2’s network, so the last step stays a hypothesis, clearly labeled below. Everything else is measured, and the raw data and scripts are linked at the end.
The symptom, quantified
Morning of July 8, from a PC behind the router (all commands and full outputs in the measurement log2):
$ ping -4 -c 60 1.1.1.1      →  96.7 % packet loss
$ ping -4 -c 60 8.8.8.8      →  81.7 % packet loss
$ mtr -c 50 1.1.1.1          →  84 % loss end-to-end
The detail that matters more than the headline numbers: the packets that did survive had 8 to 20 ms RTT. A congested path doesn’t look like this. Under genuine overload, queues build and the survivors arrive late; here the network was killing packets while delivering the rest at excellent latency.
The waves come and go on their own schedule. From the automated 10-minute monitoring on July 8: at 13:13 the line showed 0 % loss with latency spikes to 254 ms, at 13:23 it was at 14 to 36 % loss, at 13:34 at 88 % loss. Twenty minutes from “fine” to “nearly dead”, and IPv6 didn’t budge the whole time.
Experiment 1: the flow lottery
The key experiment costs nothing and requires no privileged access. During a
loss phase with roughly 90 % ICMP loss, open 20 TCP connections to
1.1.1.1:443, one after another, and time the connect:
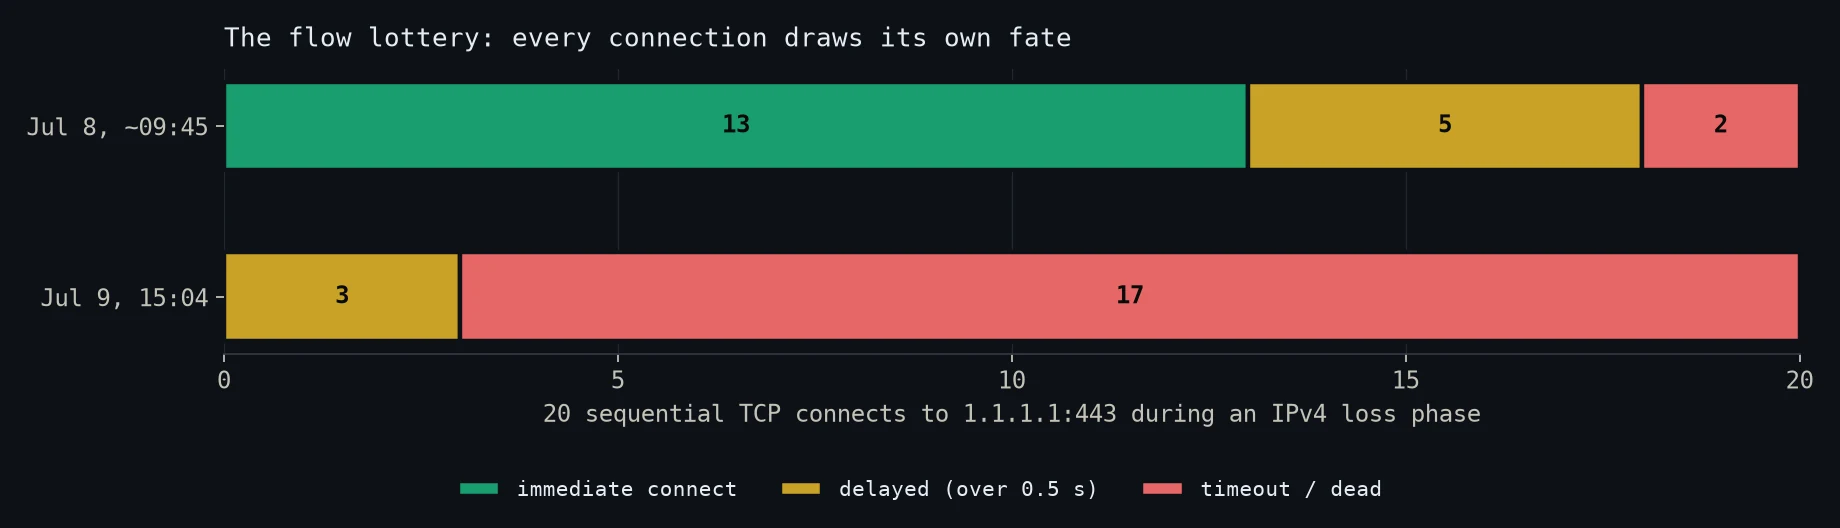
20 sequential TCP connects to 1.1.1.1:443 during an active IPv4 loss phase. Immediate means connect in milliseconds; delayed means the connect took over half a second, long enough for a retransmitted SYN; dead means timeout after 5 seconds.
On July 8, 13 of 20 connections came up instantly and worked, 5 took 1 to 2 seconds, long enough for one or two SYN retransmissions, and 2 never connected. On July 9 the same experiment during a worse phase: 0 instant, 3 delayed (2.0 to 4.1 seconds), 17 dead.
Whatever a connection draws at setup, it keeps. In a parallel test I started five sequential HTTPS downloads from the Cloudflare speed test during the same July 8 loss phase, each running alone:
flow 1:  connect failed (0 bytes)
flow 2:  153 Mbit/s
flow 3:  connect after 1.2 s, then steady 47 Mbit/s
flow 4:  connect in 0.016 s, 35 Mbit/s
flow 5:  connect after 2.1 s, then steady 29 Mbit/s
Read that again: while ICMP was losing ~90 % of packets, one TCP flow moved 153 Mbit/s through the same cell. The cell was demonstrably able to deliver full throughput. The loss was not about capacity; it was about which path your flow landed on. A single long-lived flow either lives on a good path (my WireGuard tunnel, once its handshake lands well, runs stable for hours) or suffers permanently.
The connect times above are timings, not packet captures. A connect that takes 1.2 or 2.1 seconds is long enough to contain one or two retransmitted SYNs, given Linux’s one-second initial retransmission timer, and that is how I read them, but nothing here observed a retransmission directly.
It also isn’t ICMP deprioritization: TCP SYNs and established TCP flows were hit exactly the same way, the delayed connects and the starved downloads above are TCP, not ping.
Experiment 2: IPv6 as the control group
The same morning I enabled dual stack (IPv4v6) on the router. From then on, every measurement round pinged Cloudflare over both address families: same radio, same cell, same PDP session, only the IP version differs. That is as close to a controlled experiment as you can get from the customer side of a mobile network.
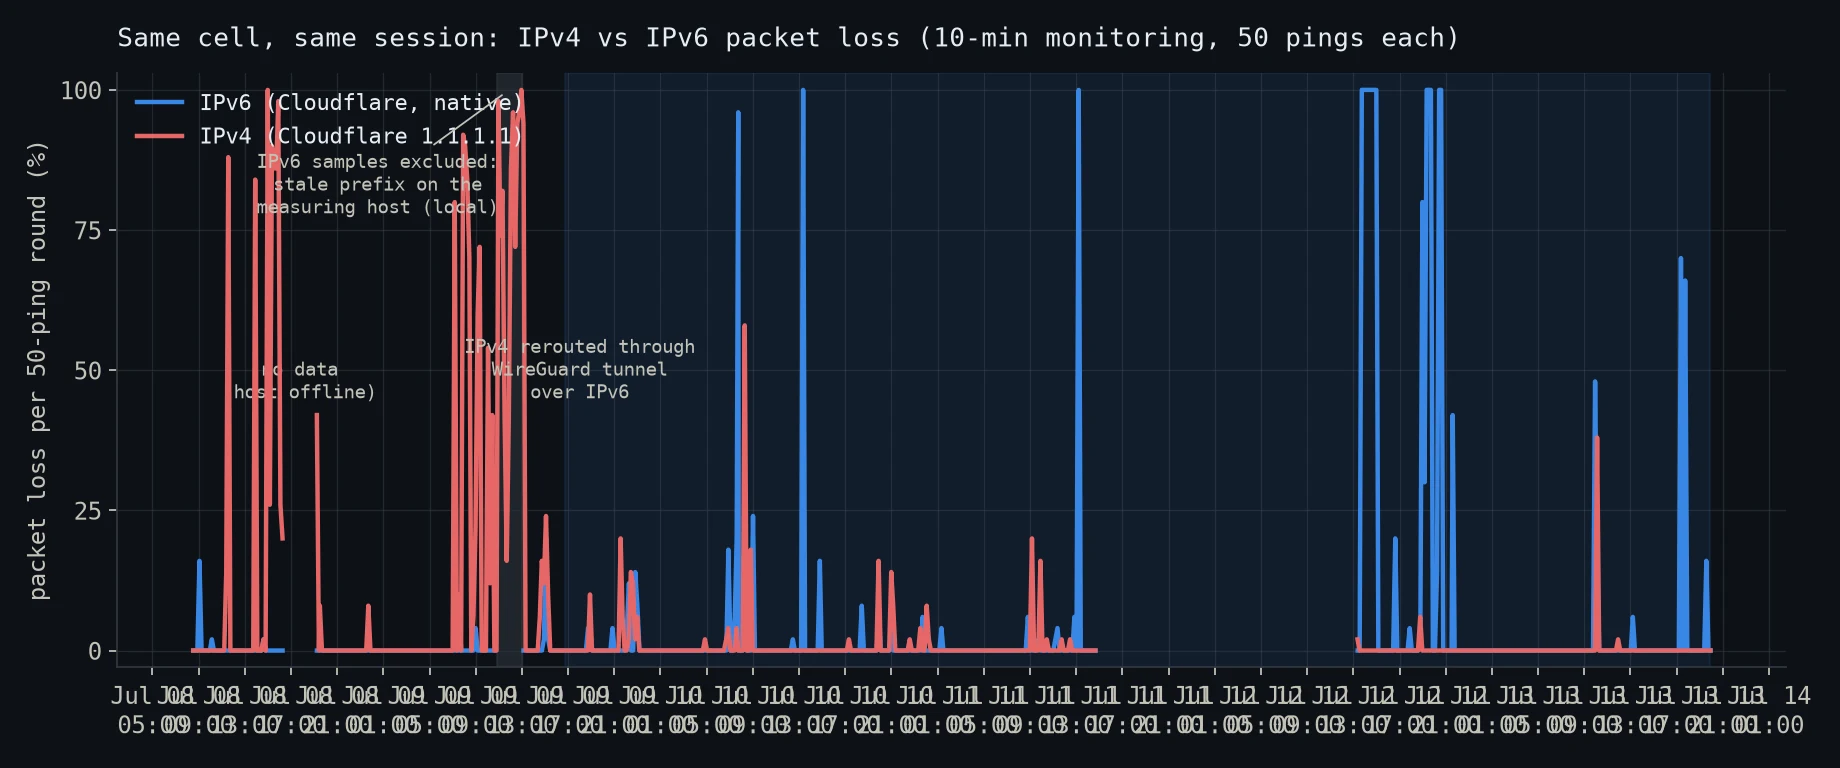
Packet loss per 50-ping round, every 10 minutes, July 8 to July 9. Both series target Cloudflare (1.1.1.1 and 2606:4700:4700::1111). The gray band marks IPv6 samples I excluded because my own measuring host kept using a stale source prefix after a carrier-side prefix change: a local mistake, documented in the methods section, not an o2 problem. The blue band on the right is the WireGuard bypass, covered below.
In every logged IPv4 loss phase, IPv6 to the same destinations ran at 0 % loss with 15 to 37 ms RTT. Over those two days of logging there were exactly two brief IPv6 blips (16 % in one round while I was physically reconfiguring the router, 2 % in another), neither of which coincided with a v4 loss phase.
This single chart eliminates most of the usual suspects at once. Radio interference, cell overload, a defective router, a defective modem, bad antenna alignment: all of these would have to break IPv4 and IPv6 equally, because below the IP layer they share everything. They don’t break equally. The fault is in whatever part of the path treats v4 and v6 differently, which is to say: behind the radio, in the carrier’s packet core.
The forum thread points the same way with different tooling: the mtr traces
posted by user Tannus in November 2025 show the loss starting at an o2-internal
hop (10.81.85.22), and his IPv6 comparison back then was already loss-free1.
What else the data rules out
- My hardware. Three different router/modem combinations across thread participants show the same signature over seven months. I additionally swapped nothing during the measurement day, and v6 through the same box was perfect.
- 5G SA vs. the LTE/NSA core. Until the day before the measurements I was on NSA; the problem was identical. Switching to SA changed nothing, so it’s not specific to one core generation (UPF vs. EPC).
- Throttling or a policer. A policer drops packets to enforce a rate; it doesn’t let one flow do 153 Mbit/s while starving its neighbors to zero, and it doesn’t leave survivor RTT at 8 to 20 ms.
- DNS, MTU, or application-layer weirdness. The measurements are raw pings and raw TCP connects to literal IP addresses. (There is also an MTU bug in o2’s IPv6 path, see the bonus section, but it’s independent and was fixed locally before the main measurement runs.)
- Coincidence. A re-dial of the mobile session sometimes fixes everything for hours. On July 9 I needed three consecutive re-dials before drawing a clean path: two dials in a row landed on broken ones. The fate is assigned per session and per flow, not per radio conditions.
The hypothesis (clearly labeled as one)
Everything above is measured. What follows is inference: the most economical explanation consistent with all of it.
Modern carrier cores spread traffic across parallel resources: link-aggregation bundles, equal-cost multi-path routes, pools of CGNAT instances. The standard mechanism picks a path per flow by hashing flow identifiers such as source and destination address, ports, and protocol, so that one flow’s packets stay in order on one path3. My traffic sits behind CGNAT (my WAN address is from o2’s 10.x pool), so it traverses exactly such machinery.
If one member of such a bundle, or one instance in such a pool, is defective or misconfigured, you get precisely this disease: a deterministic fraction of flows is broken (their hash lands on the sick member), the rest are perfectly fine, overall capacity looks healthy, and every new connection is a lottery ticket. Re-dialing re-rolls the session-level assignment, which is why it sometimes “fixes” things. IPv6 hashes onto different resources, or bypasses the CGNAT pool entirely, and stays clean.
I cannot verify this from outside; only o2 can, by reading error counters on the members of the relevant LAG/ECMP bundles and health-checking the CGNAT instances behind the affected gateway. That is exactly what the forum post asks their network team to do. What I can do from outside is one more experiment.
Experiment 3: the intervention
If the defect lives in o2’s IPv4 path, then routing my IPv4 packets around that path, while changing nothing else, should eliminate the loss completely. Not reduce it: eliminate it.
So that’s what I did. A cheap VPS (the same one from the 1blu IPv6 post) runs a WireGuard server that is reachable over IPv6. The router connects to it over o2’s clean IPv6 path and routes all IPv4 traffic through the tunnel; IPv6 stays native. The physical path is unchanged: same router, same modem, same cell, same session. Only the IPv4 packets now travel wrapped in IPv6 until they exit at the VPS.
The result is the blue-tinted region at the right edge of the chart above. Since the tunnel went live, IPv4 through it has measured 0 % loss round after round (first verification run: 50/50 pings to 1.1.1.1 at 35 ms average, 50/50 to 8.8.8.8), while it was losing up to 100 % natively a few hours earlier. My household’s public IPv4 address is now a VPS in a German datacenter, and everything works, boringly, all the time.
You can’t ask for a much cleaner confirmation from the outside: remove o2’s IPv4 path from the equation and the problem is gone, keep everything else and it stays. That puts the defect on that path. It is not a perfect experiment, since the tunnel changes the protocol, the encapsulation, the routing policy and the far end all at once, so strictly it narrows the explanation rather than isolating a single component.
The tunnel has since stopped being a bypass at all. I switched it off on July 21 to see whether the native path could carry the household on its own, left it off for three weeks, and brought it back on August 13 in a much smaller role: its allowed range is now just the addresses on the VPS itself, so it carries traffic to the private services I run there and nothing else. General internet traffic, including packets to the VPS’s own public address, goes out natively. It is a delivery route to one host, not a fallback path for the household, and if o2’s IPv4 broke again tomorrow it would not help. The native monitoring described below ran throughout all of this and is unaffected either way, because those probes never used the tunnel.
Bonus finding: o2’s IPv6 has a PMTUD blackhole
Independent of the packet loss, while setting up dual stack I found that o2’s
IPv6 path silently drops packets larger than 1420 bytes without sending
the ICMPv6 “Packet Too Big” message that path MTU discovery depends on.
Verified by ping bisection against Cloudflare and cross-checked against
Google: 1420-byte packets pass, 1428 bytes and up vanish (sizes are total IPv6
packet sizes including headers). The modem’s PDP context shows no
network-signaled MTU either (checked via AT+CGCONTRDP), so the router has no
way to learn the limit; big packets just die in the dark.
The symptom at the browser level is “half of all websites hang forever”, which is what happens when the TCP handshake (small packets) works and the first full-size response packet never arrives. Workaround: set the WAN MTU to 1420 on the router, which then emits Packet Too Big messages to LAN clients itself. Any o2 customer enabling IPv6 likely hits this.
The resolution, and five weeks of watching it hold
On July 16, o2’s forum moderator replied in the thread1: their engineering team had “turned a screw here and there”, the packet loss should be gone, the improvement applies only in the LTE and 5G-NSA network, and customers should disable 5G standalone. Vague on its own. But by then I had moved the monitoring onto the router itself, running around the clock, and one detail makes it powerful: the native IPv4 probe is bound to the modem interface and the native IPv6 probes originate on the router, so both bypass the tunnel’s policy routing and measure o2’s real path directly. That gave me a clean before-and-after on my own line, and then five weeks to see whether it held.
What follows starts on the day itself and then widens out to the whole period.
The 5G standalone footgun
o2’s advice to disable 5G SA is not cosmetic, and I learned why the hard way. On the 16th there was a roughly two-hour outage with every target at 100 % loss, the tunnel included. For about the first 50 minutes QENG documents the modem camped on a 5G SA cell in limited service (no normal registration, no data; the band shown as n77 while in limited service, later recognised as n78 again, the same cell; signal fine, RSRP around -95 dBm, SINR near 20). After that the modem’s AT port was intermittently unreachable, so I have no continuous radio log for the rest of the window. The data connection came back a couple of minutes before the router’s watchdog rebooted the modem, and from then on it ran over NSA. Since then I have SA masked out at the modem (empty SA band list plus nr5g_disable_mode=1, so it cannot attach to an SA cell at all while NSA stays fully active), and it has been stable. If you are on this network with a router you can configure, locking out SA is worth doing.
What changed the same afternoon
Here is where the router logs earn their keep. At 15:25 on July 16 my line re-attached with a new address, and two things changed that go beyond “the loss stopped”:
- My public IPv4 moved to a different range, and so did the private address
the modem is assigned. That was visible within minutes; what I could not know
at the time was whether it would stick. It did, and the figure below is the
whole story rather than the first afternoon of it.
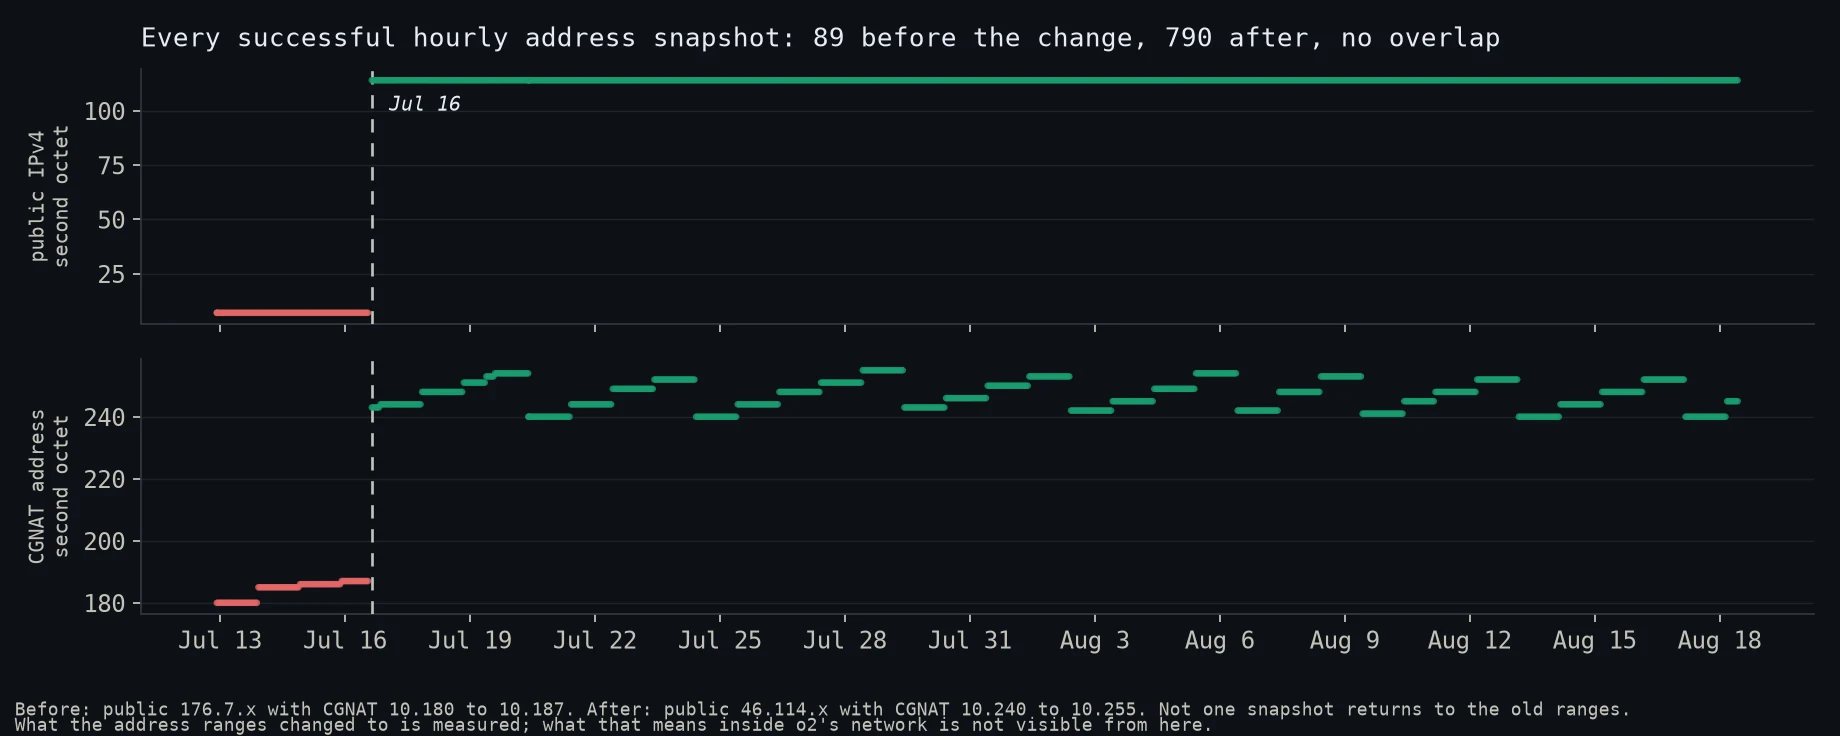
Every successful hourly address snapshot from the router. Before the change: public 176.7.x with a CGNAT address in 10.180 to 10.187. After it: public 46.114.x with a CGNAT address in 10.240 to 10.255. The two sets do not overlap and not one later snapshot falls back. The daily walk visible in the lower panel after the change is the forced reconnect drawing a new address each morning.
Written out: 89 successful snapshots before the change, every one of them public
176.7.x, and 88 of those also carrying a CGNAT address, all in 10.180 to
10.187. The odd one out is the very first poll, which recorded no CGNAT value.
After the change, 790 snapshots, every one public 46.114.x paired with a CGNAT
address in 10.240 to 10.255. Across the 41 re-attaches since, the third octet
of the public address has only ever been 0 through 7, and nothing has fallen back
to the old ranges once. Two hourly polls failed outright, both during the
standalone outage on July 16; they are missing rather than zero.
- On the native path, o2-internal hops no longer show up in a traceroute.
Before, a traceroute toward an external target walked through o2-internal
hops, with the loss visibly beginning at one of them (
10.81.85.22, as documented in the thread). Now it shows one hop and then the destination, and a TTL=1 ping from the router reaches a public target and comes back answered. From the customer side the o2 segment now looks like a single hop.
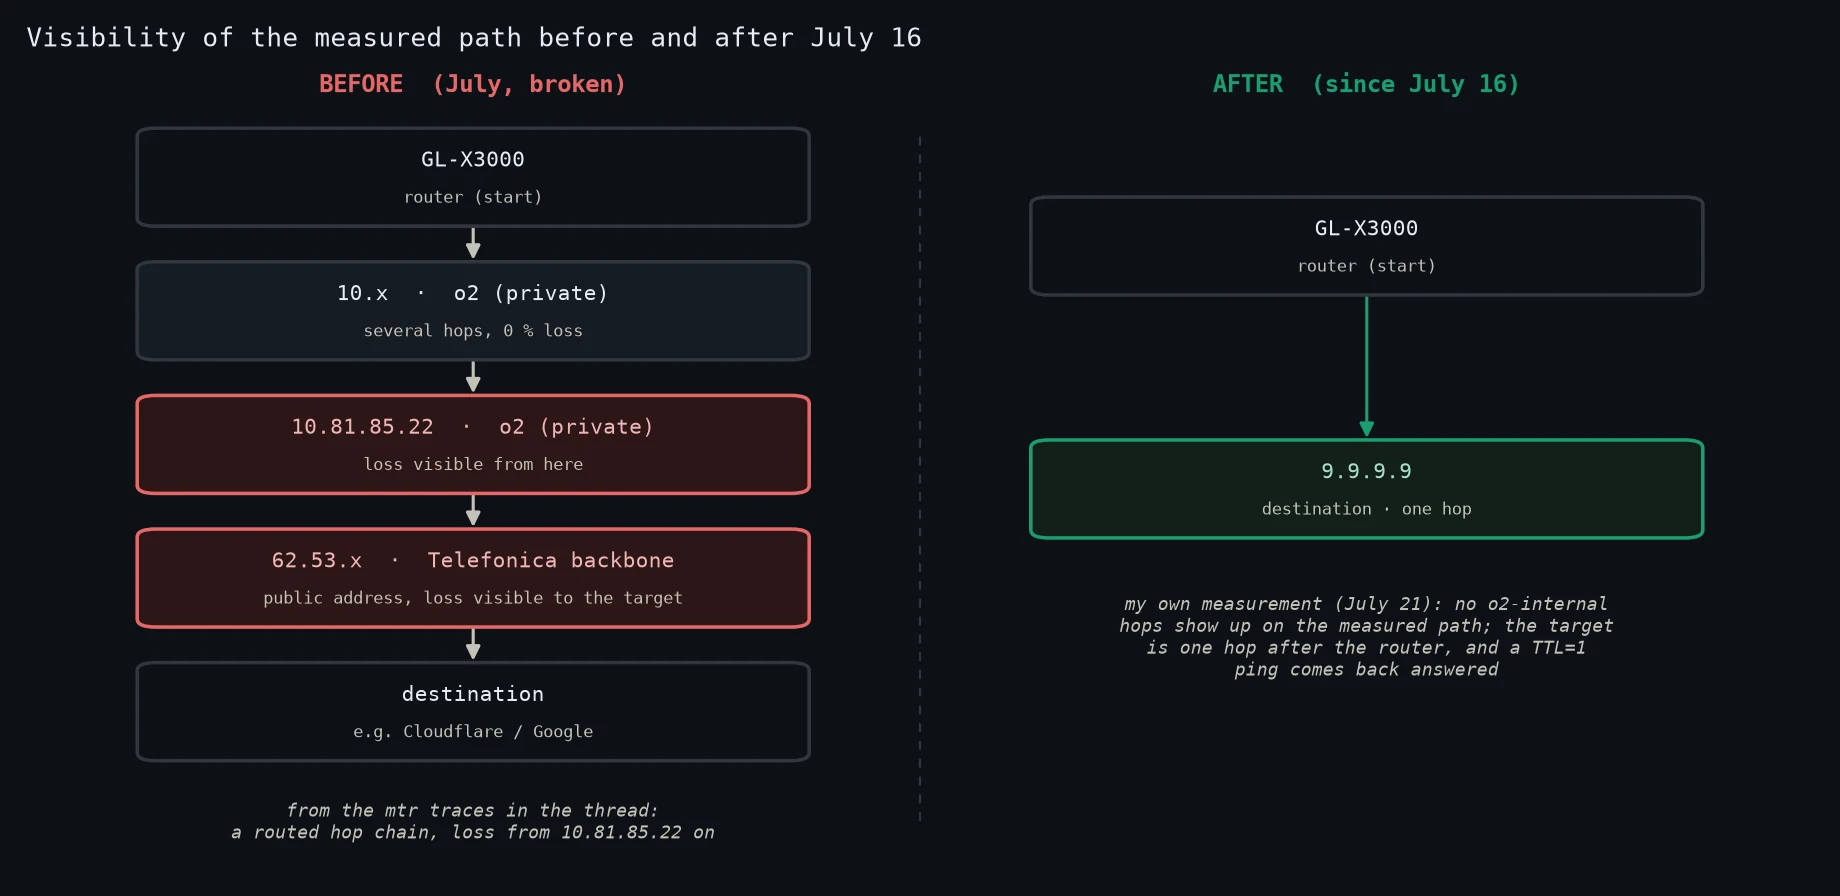
Left, the routed path from the thread’s mtr traces: loss visible from the private o2 node 10.81.85.22 and on through the public-addressed Telefonica backbone (62.53.x) all the way to the destination, both part of the Telefonica/o2 network. Right, my own measurement on July 21: no o2-internal hops show up on the measured path. The before column is the thread’s data, not my own capture; the after column is mine.
The range change and the single-hop traceroute are both measured. What they mean is not. A different gateway or CGNAT platform, a tunnelling or proxying step in the core, or a genuine repair of the old path would all look similar from the customer side, and a traceroute collapsing to one hop has several possible causes on its own. I cannot tell those apart from outside, so I will not claim I know their internal architecture changed. It does fit o2’s own wording (a screw turned, improvement only in the LTE and NSA core). What matters to me is that the fault has not reproduced.
Why the monitoring had to change
Five days after the change I ran the diagnostic test by hand: 30 native TCP connects from the router and 30 from a PC on the native path, plus 100 pings, and ten HTTPS connects each to eight different destinations. All of it came back clean, connect times tracking nothing but distance to the target. In the same five days the router logged thirteen IPv4 re-attaches with no return of the fault, one of them even landing on the address it had just given up.
That was reassuring and close to worthless as evidence, for a reason worth
spelling out because it shaped everything after. The 20-connect lottery only
fired automatically when the native ping to 9.9.9.9 crossed 30 % loss. The old
fault was target-dependent, and 9.9.9.9 was frequently spared while Cloudflare
was not, so the trigger almost never pulled. I had a test that could detect the
fault and a trigger that rarely noticed it was needed.
So I changed the design rather than waiting: the lottery now also runs on a fixed schedule twice a day whether anything looks wrong or not, and a lighter probe opens four connections to each of four destinations every ten minutes, unconditionally. Everything below comes from those, and from the ping monitor that had been running since July 12.
Five weeks of the native monitor
The ping monitor has been running since the evening of July 12. Calling that uninterrupted would be wrong: the router rebooted eight times in the period, five of them on July 20 alone. What it produced is a near-continuous series anyway, because each reboot costs about the length of one scheduled round. The largest gap in the whole IPv4 series is 12.7 minutes, and the three series plotted below never exceed 12.9; a fourth native probe, to my own VPS, has one twenty-minute gap on July 20 and one missing round.
Here is all of it, including the parts that made me nervous.
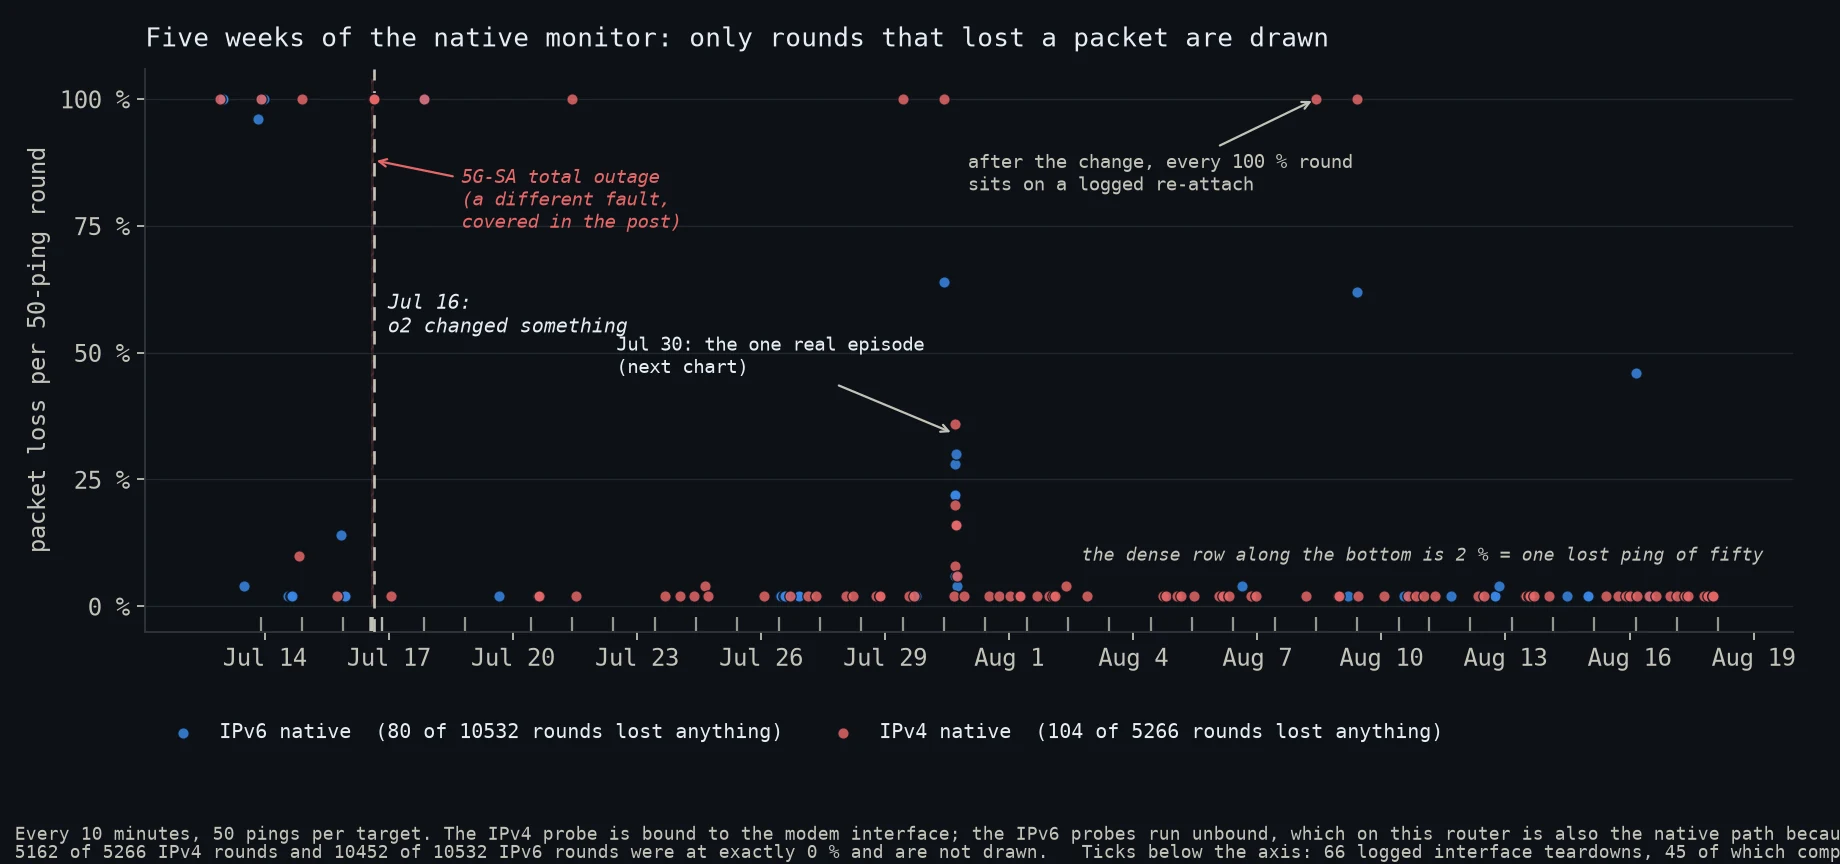
Every 10-minute round from the router-side monitor, July 12 to August 18. Only rounds that lost something are plotted: 5,162 of 5,266 IPv4 rounds and 10,452 of 10,532 IPv6 rounds were at exactly 0 %. The IPv4 probe is bound to the modem interface and the IPv6 probes originate on the router, so both measure o2’s own path rather than my tunnel. The plot shows the two public resolver targets; the third native IPv6 target, my own VPS, is reported in the text.
Since the July 16 change the native IPv4 monitor has run 4,726 rounds, and they divide up cleanly:
| rounds | |
|---|---|
| no packet lost at all | 4,639 |
| one to three packets of fifty lost | 75 |
| inside the July 30 episode (4 to 36 % lost) | 6 |
| everything lost | 6 |
The six total-loss rounds each sit within seventy seconds of a logged interface teardown, the daily forced reconnect, which takes about ten seconds from teardown to a new address. The July 30 rounds get their own section below.
Alongside IPv4 the monitor pings three native IPv6 destinations: Cloudflare, Quad9, and my own VPS. Cloudflare and Quad9 together ran 9,452 rounds since the change with 36 that lost anything and exactly two at 100 %, both of those also on a reconnect. The VPS target adds another 4,725 rounds, 10 of which lost anything and one of which lost everything.
Three IPv6 rounds in the overview chart sit far above the rest without being total: Cloudflare at 64 % on July 30, 62 % on August 9 and 46 % on August 16. All three land within a minute of a logged teardown, the same daily reconnect as the IPv4 total-loss rounds, caught mid-round instead of covering it.
The same caveat as before still applies and I will not paper over it: the only
continuous IPv4 ping target is 9.9.9.9, and the old fault was
target-dependent enough that 9.9.9.9 was rarely the destination it reached.
A flat line here is consistent with the fault being gone, but on its own it
would also be consistent with the fault hiding somewhere I am not pinging.
The weight sits on the TCP evidence below.
The flow lottery, eighty-two runs in
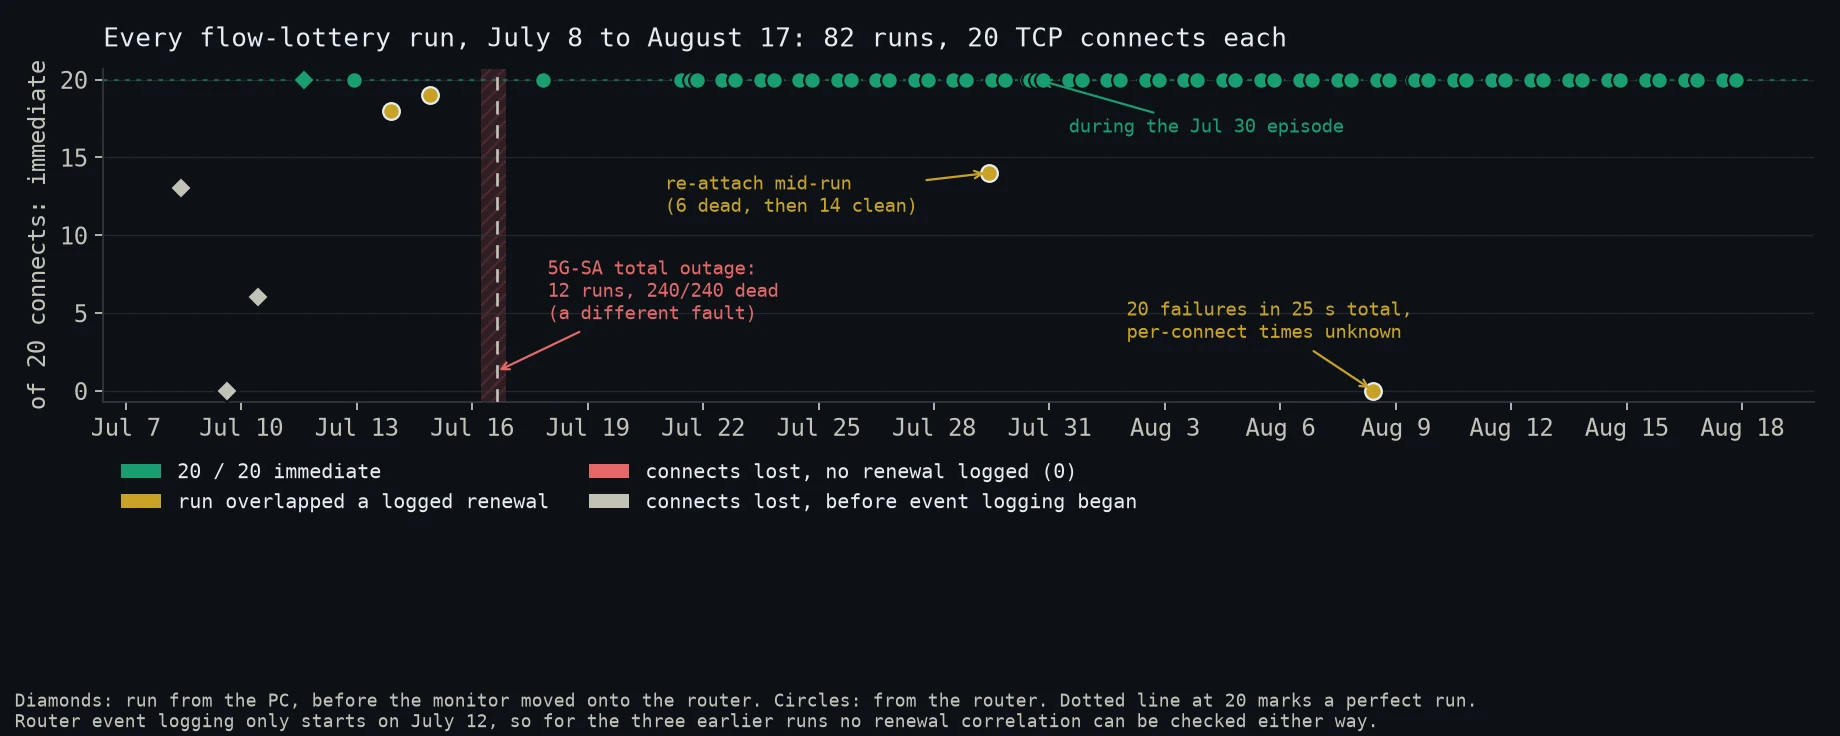
Every flow-lottery run since the experiment began: 20 sequential TCP connects to port 443 each. Diamonds are runs from the PC before the monitor moved onto the router on July 12, circles are from the router.
The scheduled lottery has run since July 21, twice a day at noon and 8 pm apart from the setup run that first afternoon. That is 56 runs, 1,120 sequential TCP connects, every single one immediate. Not one delayed connect, not one timeout.
That record is cleaner than it deserves to be, for a reason worth stating: fixed times of day mean the scheduled runs never sample a reconnect. Not one of the 56 falls within twenty minutes of a logged teardown, because the teardowns cluster around ten in the morning and, more recently, half past three at night. The scheduled series therefore says nothing about how the line behaves during a reconnect. What does sample those moments is the triggered lottery, which fires on loss rather than on the clock, and that is where both of the ugly runs below come from.
A second, lighter probe runs every ten minutes and opens four connections to each of four destinations, one of them the Cloudflare address the old fault actually reached. Over the same period it logged 63,776 connect attempts with only two outcomes: 63,744 completed the TCP handshake in under half a second and 32 took longer. None died and none failed to resolve. Of those 32, every one was between 1.0 and 1.3 seconds, the slowest 1.28. That is about the length of one retransmission timeout, which is consistent with a single lost SYN rather than the multi-second stalls the fault used to produce, though a connect time is not a packet capture and I did not measure the retransmission itself.
One more piece of small print: this probe measures the TCP handshake, so “none
died” means no connection failed to establish. It is not a claim that 63,776
HTTPS requests succeeded. Twenty-eight of them returned a non-zero curl exit
after the handshake stood: twenty receive errors against 9.9.9.9, seven TLS
connect errors and one timeout against heise.de. Those are failures above the
handshake and I have not chased them down; they are noted here so the aggregate
is not read as 63,776 clean HTTPS requests.
That aggregate has a hole in it, and it is exactly where you would not want one. The runner gives this probe twelve seconds and kills it if it overruns. The probe writes its results only after all sixteen connections finish, so a kill discards the whole round. The runner keeps its own log of every probe it starts, and in the window that log covers, from the evening of July 21 onward, the TCP probe was killed exactly twice: July 29 at 10:10:54 and August 8 at 10:00:54. Those are precisely the two rounds discussed in the next section, the ones where the deep test found dead connects.
So the honest version of the sentence is not “nothing died in a month” but “nothing died in any of the 3,986 rounds that produced data, and the two rounds that produced none are the two I am about to examine in detail”. Missing data that correlates perfectly with the interesting moments is worth more suspicion than a clean number, so here it is up front rather than in a footnote.
The two runs that looked like a relapse
Two runs in that period came back looking exactly like the old disease. On July 29 a triggered run returned 6 dead out of 20. On August 8 a triggered run returned 20 dead out of 20. If you only read the totals, the fault is back.
One disclosure before the comparison, because this post is about destination
dependence: the July 9 run I am comparing against targeted 1.1.1.1, while
July 10 and every run since target 1.0.0.1. Both are Cloudflare resolvers on
the same anycast service, and the July 10 run is the like-for-like comparison,
but the address is not identical across the figure.
The totals are the wrong thing to read. The lottery logs each connect in order, and the order is the whole argument.
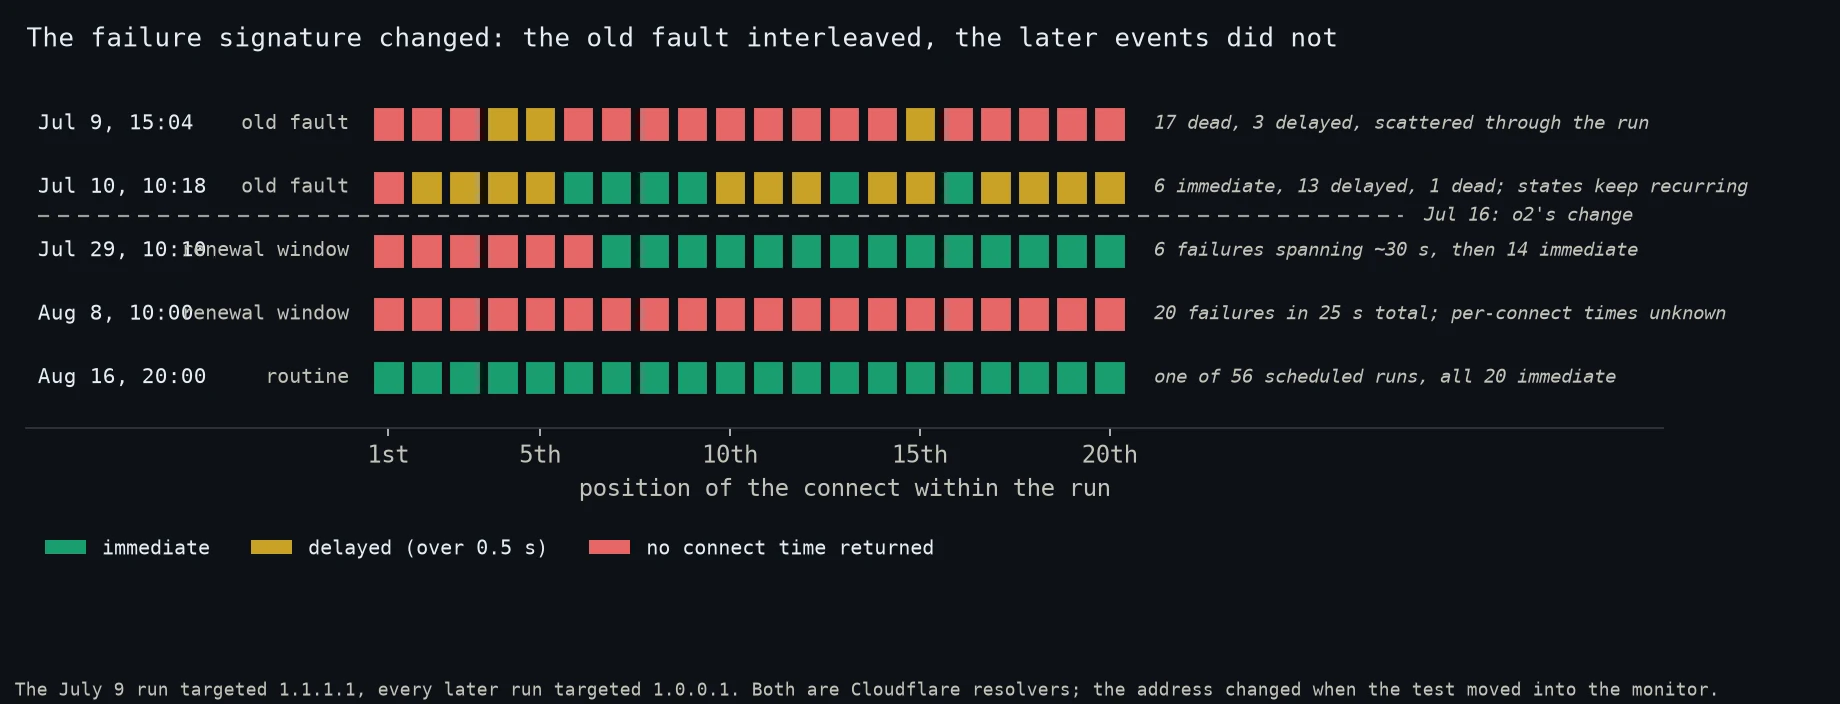
The twenty-connect test drawn in the order the connects happened. Under the old fault the run changes state repeatedly. The July 29 run changes state once, and its failing half spans a logged interface teardown; individual connects are not timestamped, so the transition cannot be pinned to the second. The August 8 run never changes state; its twenty failures took 25 seconds in total, but the log does not record how long each one took. The July 9 run targeted 1.1.1.1 and the rest 1.0.0.1, both Cloudflare.
Under the old fault, outcomes interleaved. On July 9 the three connects that survived at all were numbers four, five and fifteen, with dead ones on either side. On July 10 the six fast connects were numbers six through nine, thirteen and sixteen, mixed in among the slow ones. There are short blocks in there, four fast in a row on July 10 and four slow before them, which is what you get when twenty samples are drawn one after another; what there is not is a single transition from one state to the other. The run keeps changing its mind.
The July 29 run does not interleave. The first six connects timed out and the remaining fourteen came up in 15 to 28 milliseconds each: one transition, no going back. The run started at 10:10:55, and with a five-second connect timeout those six failures occupy roughly the next thirty seconds. The router logged the interface going down at 10:11:17 and coming back with a new address at 10:11:27, inside that window. Individual connects are not timestamped, so I cannot place the seventh one to the second, but six failures, a logged down-and-up in the middle of them, and fourteen clean connects afterwards is a reconstruction I am comfortable with.
The August 8 run has no transition in it at all: all twenty died. It also died
in a distinctive way. The runner logs how long each probe takes, and that run
took 25 seconds for twenty failures. Twenty genuine five-second timeouts would
take a hundred. So most of those connects did not time out waiting for a SYN
that never came back; they failed immediately, which is what curl does when the
interface it was told to use is not usable. The lottery does not record exit
codes, so that is an inference from the timing rather than a diagnosis. Under the old fault, dead
connects were dead because packets vanished on a live path, and they cost five
seconds each. These cost about one.
That said, it is tempting to describe the round as the line being down, and that
is not what the data show. In that same round the IPv4
ping to 9.9.9.9 lost 100 %, while all three native IPv6 probes completed at
0 % with 13 to 15 ms latency, ten to thirty seconds later. IPv4 was gone and
IPv6 was fine. That is the signature this whole post is about, and I am not
going to pretend I did not see it.
Here is why I still read it as the reconnect rather than the fault, and you can weigh it yourself. Rather than summarise, here are all six IPv4 total-loss rounds since the change with what the IPv6 probes did in the same round:
| round | Cloudflare v6 | Quad9 v6 | VPS v6 |
|---|---|---|---|
| Jul 17, 20:20 | 100 % | 100 % | 100 % |
| Jul 21, 10:20 | 0 % | 0 % | 0 % |
| Jul 29, 10:10 | 0 % | 0 % | 0 % |
| Jul 30, 10:10 | 64 % | 0 % | 0 % |
| Aug 8, 10:00 | 0 % | 0 % | 0 % |
| Aug 9, 10:00 | 62 % | 0 % | 0 % |
So the uncomfortable pattern, IPv4 gone while every IPv6 probe is clean, holds for three of the six. In two more the IPv6 side was damaged but not dead, and in the first one everything died together.
The daily session renewal announces itself in the router log with an IPv6 prefix update: on August 8 at 10:00:02 and on July 29 at 10:10:08, in both cases within seconds of the IPv4 probe starting. IPv4 stops around that moment, IPv6 keeps running, and roughly a minute later the router’s watchdog forces a full re-attach. I read that ordering as the reconnect being the reaction rather than the cause, with the carrier releasing the IPv4 address first, but I want to be precise about what the log actually contains: the prefix-update line has an empty detail field. It marks that something happened to the IPv6 configuration, not that anyone withdrew an IPv4 address. The ordering is measured, the mechanism behind it is my reading of it.
What separates it from the old fault is that it is total rather than partial, resolves in about eighty to ninety seconds rather than hours (79 seconds on July 29 and 86 on August 8, measured from the prefix-update line to the new IPv4 address), happens on the same minute of the same daily cycle rather than at random, and is bracketed by logged interface events every time. The old fault had none of those properties. That is an argument from circumstance, not a proof, and if you want to read those rounds as the fault briefly resurfacing during the daily renewal, the data will not stop you.
The one real episode
Seventy minutes in the whole month do not fit the “nothing happened” story, and it would be dishonest to leave them out.
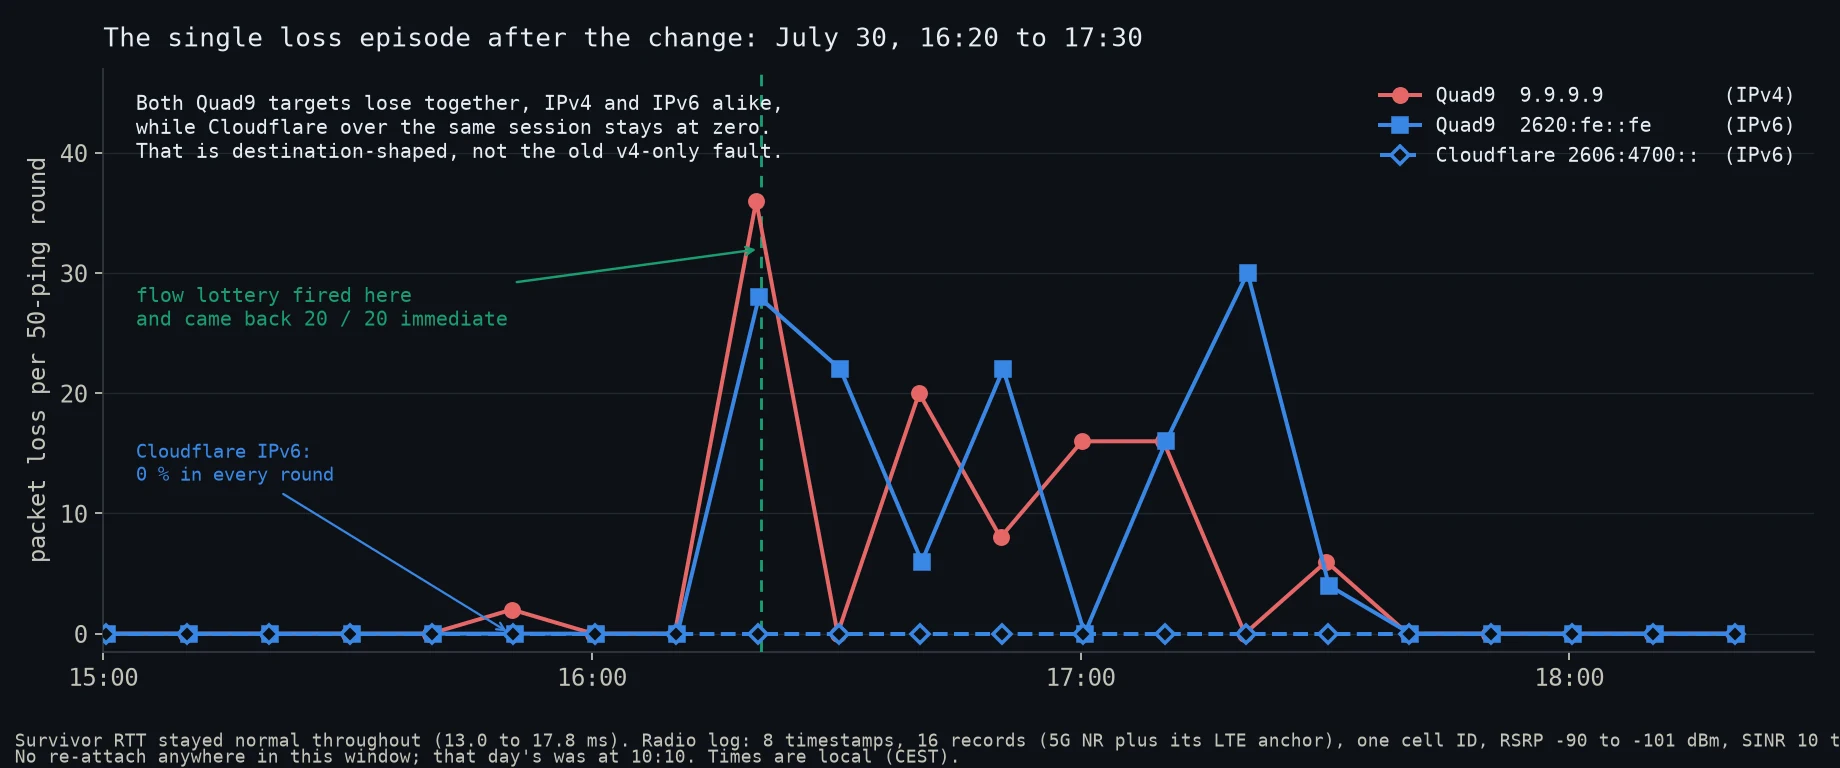
July 30, the only sustained loss episode after the change. Both Quad9 targets lose packets across the same seventy minutes, though not in the same rounds, while Cloudflare over the same session stays at 0 %. The packets that got through kept normal latency (13.0 to 17.8 ms average per round). The radio log shows one cell ID across 8 timestamps (16 records, 5G NR plus its LTE anchor), RSRP -90 to -101 dBm and SINR 10 to 21; calling that unremarkable is my judgement, not a measurement against a baseline.
For seventy minutes on July 30, from 16:20 to 17:30, the native probes lost
between 4 and 36 % of their packets. What makes it interesting is which probes.
The two that degraded were 9.9.9.9 and 2620:fe::fe, which are the same
operator over different address families: six of the eight IPv4 rounds and seven
of the eight Quad9 IPv6 rounds lost something. They did not lose it in step,
though. Round by round the two series are essentially uncorrelated, and in three
rounds one family was at 0 % while the other was losing 16 to 30 %. What they
share is the window, not the timing.
The other two native probes, Cloudflare over IPv6 and my own VPS over IPv6, ran in the same session over the same radio and lost nothing at all: eight rounds each inside those seventy minutes, 400 pings and 400 replies apiece, at 14 to 18 ms. Two independent destinations stayed perfect while a third lost up to a third of its packets on both address families.
That is the opposite shape of the fault this post is about. The old fault was IPv4-only with IPv6 as a clean control; this one hit both families of one destination and spared another destination entirely. The loss threshold also tripped the automatic flow lottery at 16:20:42, in the worst round of the whole episode, and that run came back 20 of 20 immediate. Packets were being dropped somewhere on the way to one operator while twenty consecutive TCP connections to a different one were being set up without a hitch.
There is a limit to that last sentence worth spelling out, because it is easy to overread. The lottery only ever tests Cloudflare. It has never been pointed at Quad9, so it can tell you that flows toward Cloudflare were healthy during the episode; it cannot tell you whether flows toward Quad9 were being drawn well or badly. A per-flow fault confined to the Quad9 path would look exactly like this in my data.
So I cannot say from here whether that hour was Quad9’s problem, a peering path, or something in o2 that happens to sit in front of that destination, and I cannot rule out that it was per-flow on the affected path. What the episode does rule out is the shape of the old fault: that one was IPv4-only with IPv6 as a clean control, and this one took both address families of one destination while leaving another destination untouched.
The radio, over the whole period
There is one more thing five weeks of logging can settle that a single afternoon cannot. Every ten minutes the router also records the radio state: band, cell, signal power, signal-to-noise ratio. Pairing each native IPv4 ping round with the nearest radio reading within 400 seconds gives 5,209 pairs, 98 of which lost at least one packet.
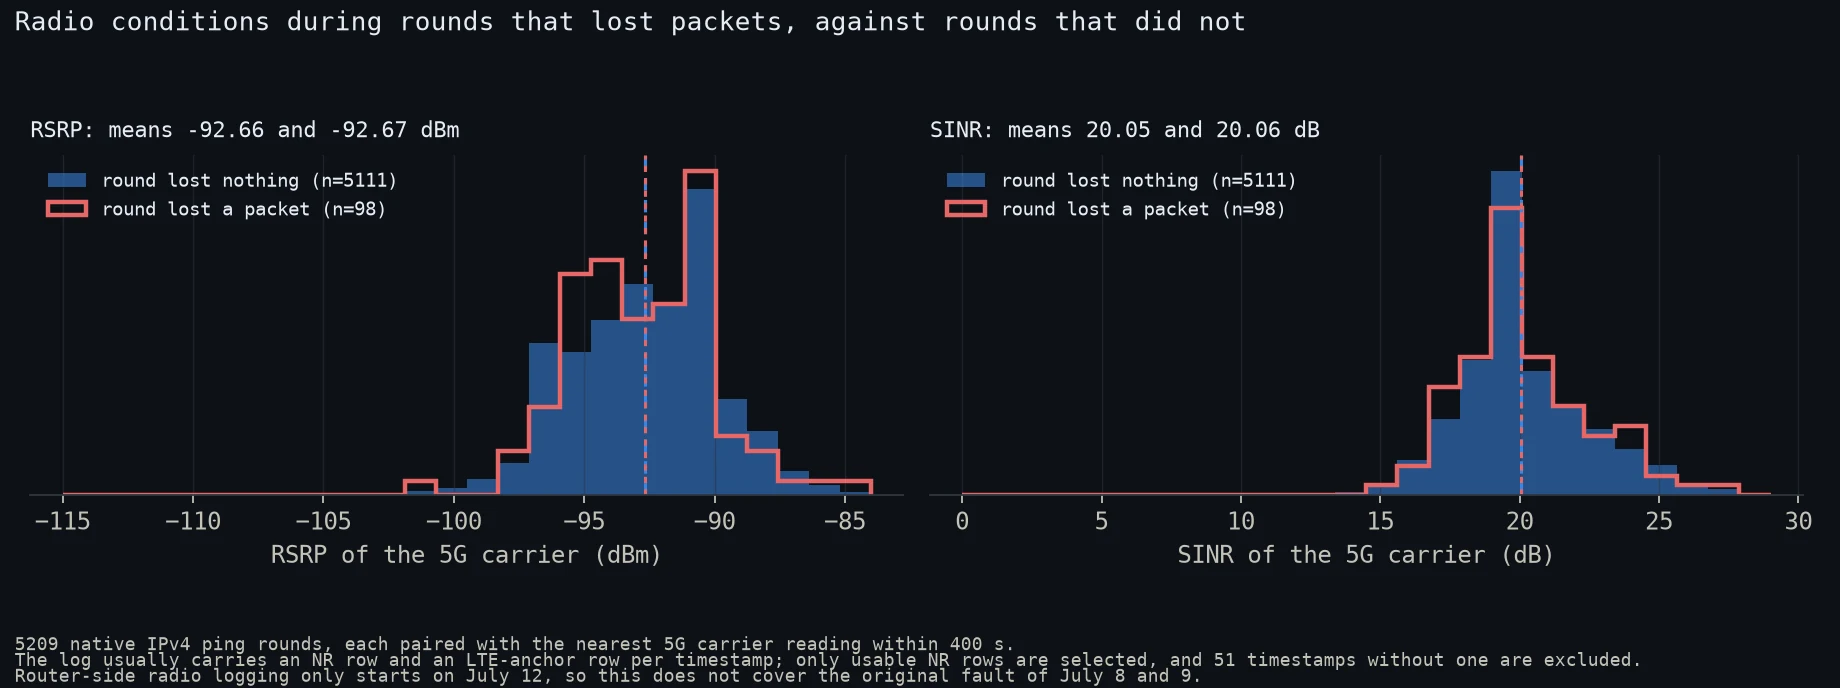
5,209 native IPv4 ping rounds paired with the nearest 5G carrier reading. Rounds that lost a packet: mean RSRP -92.67 dBm, mean SINR 20.06 dB. Rounds that lost nothing: -92.66 dBm and 20.05 dB. The rank correlation between loss and either measure is indistinguishable from zero.
The difference is one hundredth of a decibel in each direction, which is to say none. Whatever is behind the handful of remaining lost packets, it is not the radio getting worse at those moments.
Two limits on that. The radio log only starts on July 12, four days before the change, so it does not cover the original fault of July 8 and 9; the simultaneous clean IPv6 control remains the better evidence there. And a reading every ten minutes can miss a fade that lasts seconds. It is a strong null result at the sampling rate I have, not a proof that radio never mattered.
One choice inside it is worth stating because it changes the numbers: the radio log usually holds two rows per timestamp, the 5G carrier and its LTE anchor, and I use only the 5G row. Take the anchor row instead and the same comparison reads -95.3 against -95.5 dBm: same answer, different absolute values. Of the 5,265 timestamps in the log, 5,214 carry a usable 5G row and are used. The 51 that do not are dropped rather than filled in from the anchor: fifty of them are unparsed records from one afternoon on July 13, and one is a moment on July 16 when the modem sat on a bare LTE band.
Is the line any good, though?
Nothing so far says whether the line is actually any good, only that the flow-dependent fault has not come back. There is a separate hourly measurement for that: a 50 MB download and a 20 MB upload over each address family. The downloads ran 880 times per family with 878 valid results each; the uploads 865 and 866 times with 863 and 864 valid. Native IPv4 sits at a median of 149.4 Mbit/s down, native IPv6 at 127.2, and the uploads at 37.5 and 37.0. Every failed run falls in the two hours of the standalone outage on July 16. During the July 30 episode the hourly downloads still completed at 141.5 and 123.3 Mbit/s, which is one more reason to read that hour as something on the way to one destination rather than the access link falling over.
The gap between IPv4 and IPv6 download throughput is real and consistent, IPv4 being faster in 708 of 874 paired hours. The obvious suspect is the IPv6 MTU clamped to 1420 bytes because of the PMTUD blackhole described above, since a smaller MSS does cost a single bulk stream throughput. It does not account for all of it: the measured median ratio is about 1.18 while the MSS ratio alone is about 1.06, and a download test cannot separate the causes anyway. What the number does establish is narrower and worth keeping in mind: “IPv6 stayed clean” in this post means clean of loss, not equal in throughput.
Where that leaves it
Five weeks of measurement, 1,120 lottery connects with nothing delayed or dead, 63,776 logged probe connects with nothing dead at the handshake, and two runs that looked like relapses and that I read as the daily reconnect once the order and the timings are taken into account. The fault this post documents has not reproduced in a form I can distinguish from the reconnect.
That last clause is doing real work and I would rather not hide it. It is one line. The continuous IPv4 ping watches a single destination. Two probe rounds are missing from the TCP aggregate, and they are the two interesting ones. Three of the six total-loss rounds show IPv4 dead while every IPv6 probe stayed clean, which is the old signature, and my case for calling them reconnects rests on their timing and their shape rather than on anything decisive. A fault that was always intermittent could still be waiting. The monitoring stays up for exactly that reason, and if it comes back it will show up here before it shows up in my browser.
Methods, data, and honesty notes
- Monitoring: a shell script pings 1.1.1.1, 8.8.8.8, and 2606:4700:4700::1111 every 10 minutes (50 pings each, 0.2 s interval) from a wired-equivalent Wi-Fi client behind the router and logs loss and RTT to CSV. The chart is generated from that CSV by a Python script; both are available on request, and the numbers in this post come from the log, not from memory2.
- The 3-hour gap in the chart on the evening of July 8 is the measuring host being off. No data, shown as no data.
- From July 12 the monitoring moved onto the router itself and runs 24/7, which is why the later data has no host-off gaps. Its native IPv4 probe is bound to the modem interface and its native IPv6 probes originate on the router itself, so both keep measuring o2’s real path regardless of what my LAN traffic is doing. Everything in the resolution section is drawn from that series, apart from the traceroute diagram and the July 21 reproduction runs (the eight-target sweep and the router and PC connects), whose raw output lives in the change journal rather than in a CSV.
- The gray band on July 9 marks 13 IPv6 rounds I excluded: after a carrier-side IPv6 prefix change, my measuring PC kept using its old (dead) source address, so those rounds measured my own misconfiguration, proven by pinging with each source address explicitly. IPv4 samples in that window are unaffected and included. Lesson learned and documented.
- The flow-lottery connect-time thresholds: “delayed” is a connect over 0.5 s, which given Linux’s 1 s initial SYN retransmission timer is consistent with at least one lost SYN, though the script times the connect rather than capturing packets. “Dead” is any connect that returned no time at all: usually a five-second timeout, but also an immediate failure, which is what the timing points to on August 8.
- Sample sizes for the original analysis are what they are: two flow-lottery runs of 20 connects, one five-download run, and roughly 180 monitoring rounds over two days. The per-flow fate pattern is consistent across all of them and with seven months of reports in the forum thread1, but I’d happily trade this entire post for one look at o2’s internal interface counters. The one-month section rests on a much larger sample, which is the point of having left the monitor running.
- The six charts covering the logged period are generated from the router’s own
CSVs by one script, which reads
loss.csv,tcp.csv,lottery.csv,lottery-daily.csv,events.csv,radio.csvandwan.csvdirectly. Every plotted point from July 12 onward therefore comes from the logs rather than from my notes. The four exceptions are the pre-router lottery runs of July 8 to 11 in the timeline chart, which are typed in and discussed in the next bullet. Annotations, the connect-order strings in the signature figure and a handful of figures quoted inside captions are literals in the script that I checked by hand; they can drift if the data changes and nobody re-checks them. - Every number in the prose is produced by a second script that reads the same CSVs and prints them as a list, so refreshing the article is a comparison rather than a recount. It takes a single cut-off timestamp that applies to every file at once. Without that, two files read seconds apart already disagree about the denominator while the monitor keeps running.
- The four flow-lottery runs from July 8 to 11 predate the router-side monitor and are typed into the chart script. July 9, 10 and 11 come from the PC logs and can be reproduced from them. July 8 cannot: its 13 immediate, 5 delayed and 2 dead survive only as a summary line in my change journal, with no surviving per-connect log. Take that one run on my word or discount it.
- Not every measurement here has the same evidential weight, and it is worth saying which is which. Everything from July 12 onward exists as machine-written CSV that anyone can recount: the ping rounds, the TCP probe, both lottery files, the router events, the radio log. Everything before that, and the one-off tests of July 21 (the eight-target sweep, the 30 plus 30 control connects, the traceroute and TTL=1 checks, the MTU bisection, the five downloads), exists as terminal output pasted into my change journal. I stand behind those numbers, but they are a transcript rather than a log, and you should weigh them accordingly.
- Four of the ping probes were bound to the WireGuard tunnel (
1.1.1.1,8.8.8.8and the two tunnel-internal addresses), so they sit at 100 % loss for most of the window covered here, because the tunnel was off from July 21 to August 13. That says nothing about o2 and those rows are excluded from every chart. For the period this article covers, only9.9.9.9and the three IPv6 targets measure the native path. - Since writing this I have rebound
1.1.1.1and8.8.8.8to the modem interface, because the tunnel’s allowed range was later narrowed to the VPS addresses and those two probes had stopped measuring anything at all. Anyone reading the raw logs later should know the columns change meaning on August 18: tunnel path before, native path after. It also closes the gap this article has to admit, that the continuous IPv4 monitor watched a single destination and not the one the fault actually reached.
If someone from o2’s network engineering reads this: the thread1 contains the concrete ask. From outside I could only ever measure that some flows died while others ran at full speed. Inside, every link in an aggregation bundle and every instance in a CGNAT pool keeps its own error counters, and one of them would have been naming the culprit the whole time.
“Massiver und protokollunabhängiger Paketverlust im o2 Netzwerk”, o2 community forum, thread 661479, running since November 2025: https://hilfe.o2online.de/mobilfunk-zu-hause-homespot-router-software-internet-telefonie-21/massiver-und-protokollunabhaengiger-paketverlust-im-o2-netzwerk-661479 ↩︎ ↩︎ ↩︎ ↩︎ ↩︎
Monitoring CSV (timestamped loss/RTT per target), the chart-generation script, and the raw command transcripts of the experiments are kept with my change journal for this incident. If you want them for reproduction or a dispute with the same symptoms, contact me and I’ll share the set. ↩︎ ↩︎
C. Hopps, “Analysis of an Equal-Cost Multi-Path Algorithm”, RFC 2992. Describes hash-threshold path selection: a hash over the fields that define a flow selects which of several equal next-hops carries it, keeping each flow on one path: https://datatracker.ietf.org/doc/html/rfc2992 ↩︎